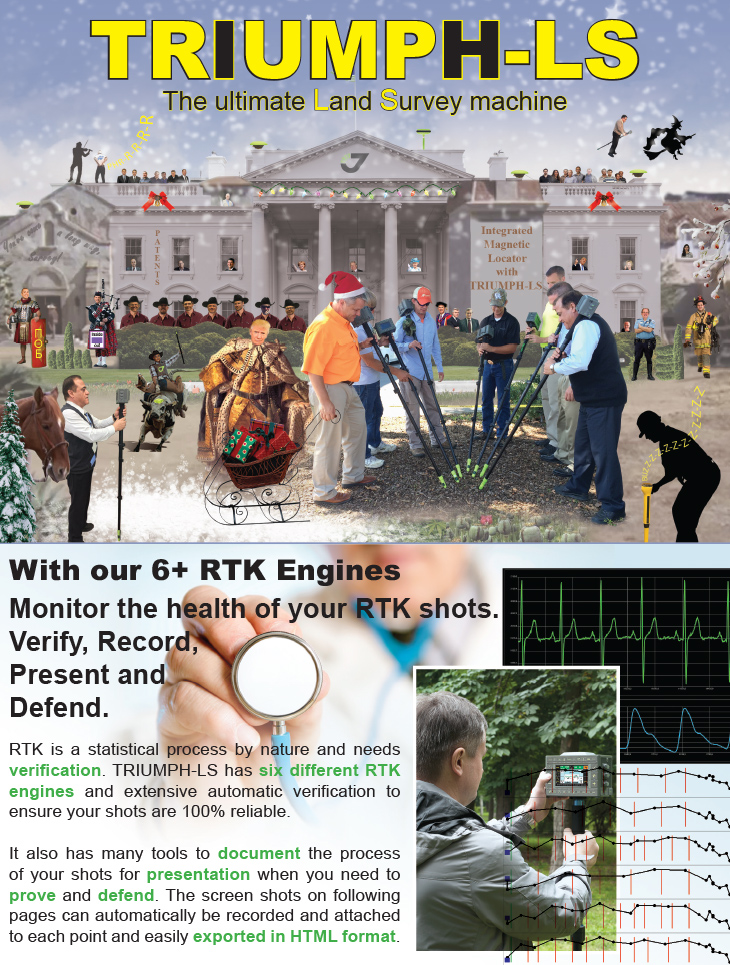
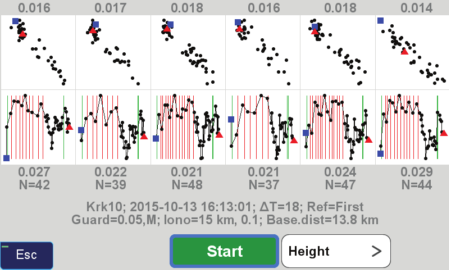
RTK Verification, Phase-1
This graph shows the horizontal and vertical RTK epochs of Phase-1 along with their statistics. Each epoch is the average of six RTK engines.
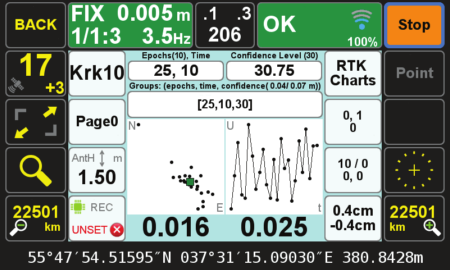
RTK Verification, Phase-2
In Phase-2 the best ambiguity solution is selected and RTK is continued with the best ambiguity selection.
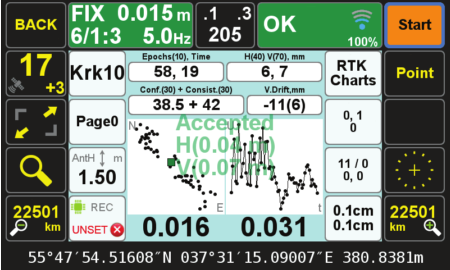
Phase-1 horizontal and vertical solution of each engine for each epoch.
Horizontal and vertical view of each engine in Phase-2. At the end of the process, all engines are reset once more to ensure correct ambiguity resolution.
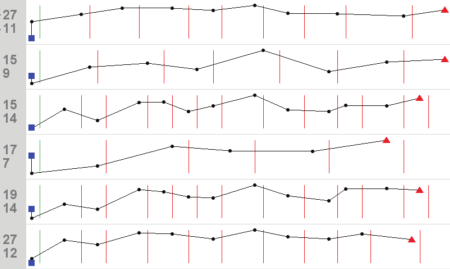
Expanded view of the vertical solution of each engine. Vertical red lines show the instants in which each engine has been reset and ambiguity solutions recalculated.
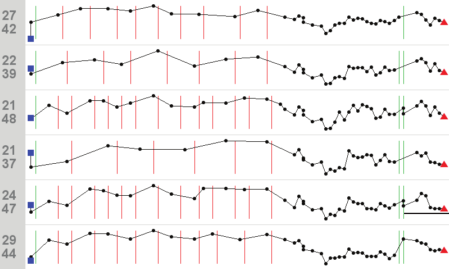
Similar expanded view of the vertical solutions in Phase-1 and Phase-2.
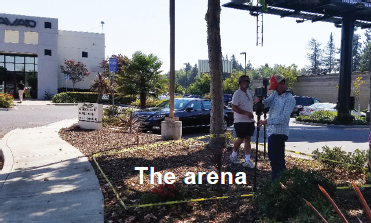
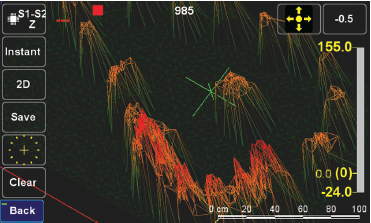
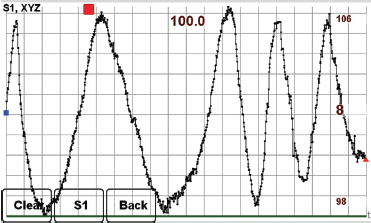
The site has a great deal of ambient noise from a nearby freeway and construction work.
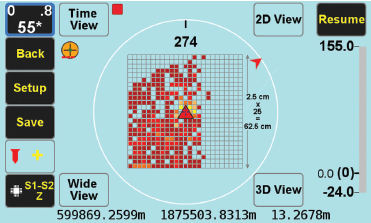
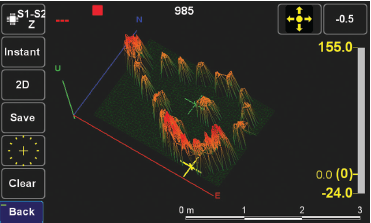
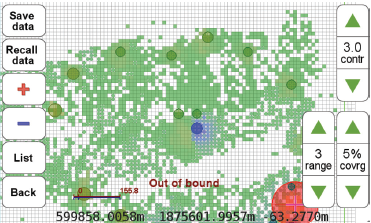
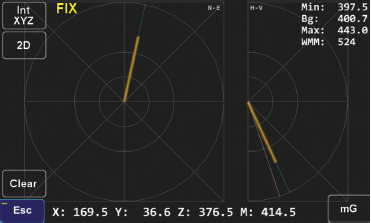
The audio and graphical bar on the right side show the magnitude of the magnetic object.
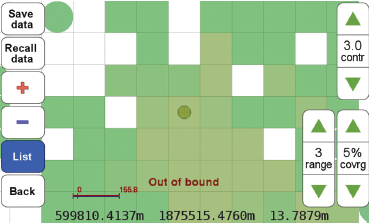
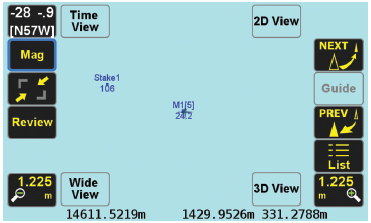
In “Setup” you can select the cell size and the size of the field you want to scan.
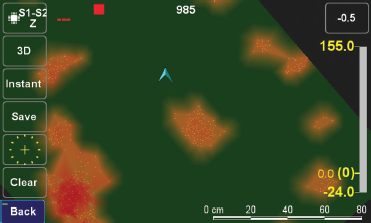
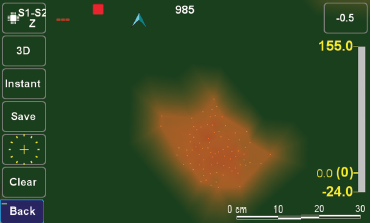
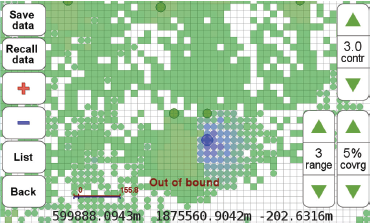
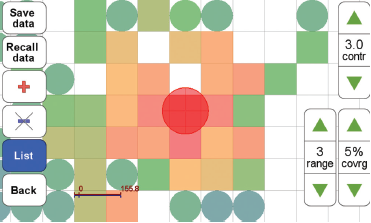
Zooming the 2D screen can show the shape of the magnetic objects under the ground.
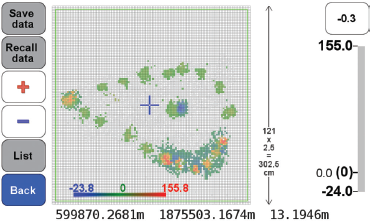
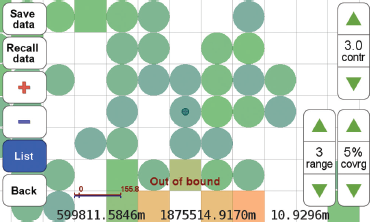
 When zoomed to any selected point, the
characteristics of the cells around the peak
are shown. Squares show the positive and
circles the negative cells. Cell sizes are
programmable. Similar to the MRI used by
doctors!
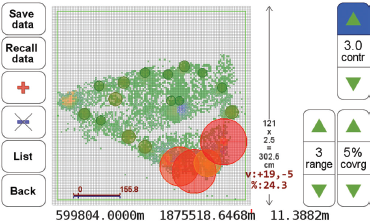
When zoomed to any selected point, the
characteristics of the cells around the peak
are shown. Squares show the positive and
circles the negative cells. Cell sizes are
programmable. Similar to the MRI used by
doctors!
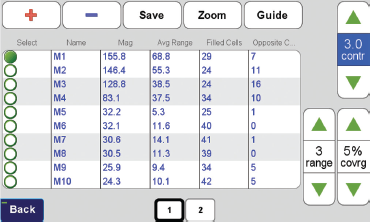
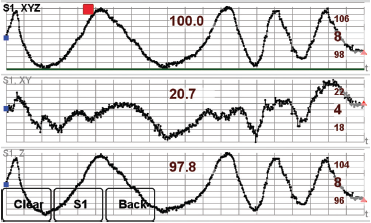
Below graphs show the Time View of the mag values of the two sensors and their difference as scanning is in progress. Clicking on any graph shows its expanded view.
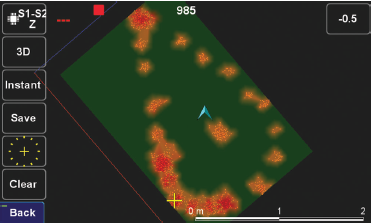
Field View
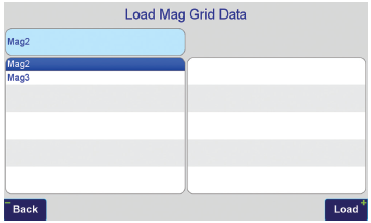
When you save a point, you can also save all the raw Mag sensor data for future view and documentation.
Work Flow
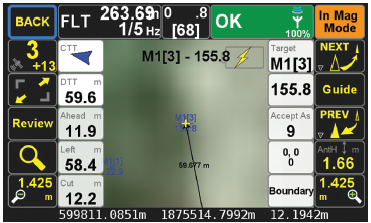
Then the “Mag” screen locates your underground target and determines its coordinates. You can also save this point.
And finally in the “Collect” screen, you can survey the target point which you have dug up and exposed. This is also the time to use the built in camera of the TRIUMPH-LS to photograph and fully document the evidence which you have recovered.