Many jurisdictions dictate that surveyors using RTK revisit critical cadastral points several times in order to demonstrate the results of the survey are reliable. These sorts of mandates are meant to trap inevitable errors encountered while pushing GNSS technology to the limits of operability under canopy or nearby obstructions. Producing the same bad coordinate multiple times (such as three observations, separated by several hours) is still possible considering that the base coordinates could be mis-entered, the base receiver could be setup on the wrong point and possible centering and leveling errors at the base and the rover. With Javad's J-Field, VB-RTK using DPOS, and the Base/Rover Setup procedure the risk associated with the base coordinates being mis-entered or the base receiver being setup on the wrong point are substantially reduced, proving that smart technology can help surveyors minimize commonly encountered blunders.
The rigorous verification process found exclusively in J-Field, uses the six RTK engines of the TRIUMPH-LS to quickly fix and then force a loss of fix for a user defined number of times to prove the point being collected was not the result of a bad fix. In as little as a few seconds, J-Field's verification process provides confidence to surveyors that their positions are defensible and reliable. Other systems require numerous manipulations by the user to perform a fraction of what J-Field does automatically. Consider that most RTK users today, desiring to prove RTK results are valid, must collect a point, then manually reset the RTK engine, collect a second point and then compare the first to the second to determine if there is acceptable agreement. This is a tedious and time consuming process that provides one single check on the fixed integer ambiguities.
Even with the exhaustive verification procedures in J-Field, the legal obligation in some locales for surveyors to revisit a point hours later remains. J-Field's newest feature, Cluster Averaging makes evaluation of these repeat visits automated and simple. Once a surveyor has collected a point several times, he can initiate Cluster Averaging which searches the points that are visible in the database and finds all occurrences of points that are within a user defined horizontal range of one another. These occurrences are referred to as “Clusters”. Next the user is notified of the number of clusters found in the database with the option to create an average point for each cluster. A graphic representation of each cluster is provided, along with the extreme spread of the points in the cluster expressed in North, East and Up. Finally, a rich report is provided with vital statistics of each point used to create the cluster and for the resulting average point. All of this is done automatically, with minimal user involvement, with staggering speed and detail.
It is also possible to manually produce Cluster Averaging, one cluster at a time from the Review Screen. (Home → Collect → Review). First let's look at the one at a time, manual approach in Review:
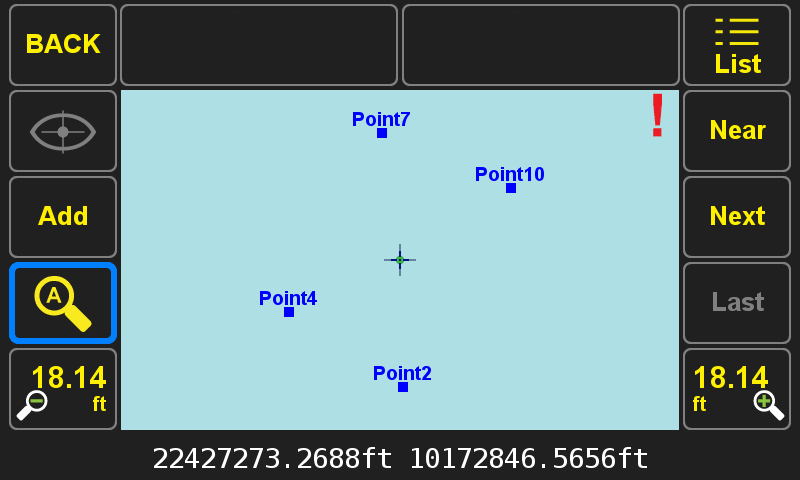
Here are four groups of surveyed points (notice the dots are bold squares indicating each dot is composed of more than one point).
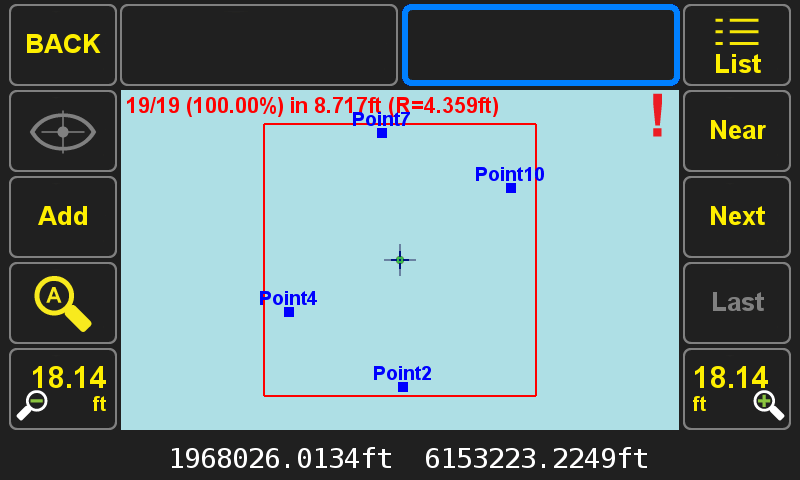
Pressing the selection button (shown in blue here) shows that there are 19 points within this red square.
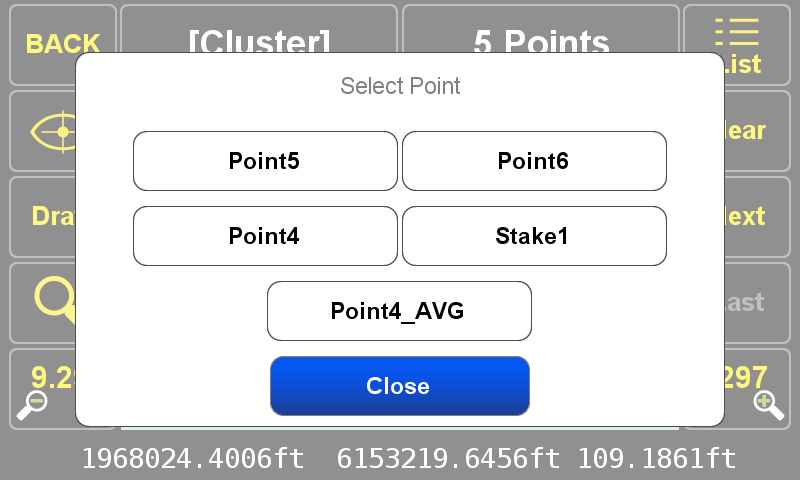
Dragging the cursor over one of the Clusters of points and pressing the Eye/Crosshair icon presents a options for points within the Cluster radius. In this example, Point4, Point5 and Point6 are individually surveyed points. Stake1 is a design point, created from entering coordinates. Point4_AVG is an average point created previously created from Cluster Averaging.
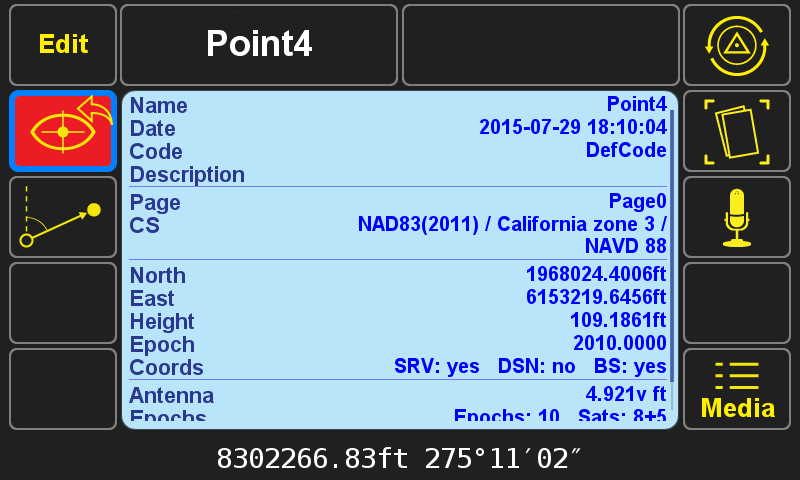
After selecting a point from the cluster, press anywhere on the blue field to see additional statistics about the selected point.
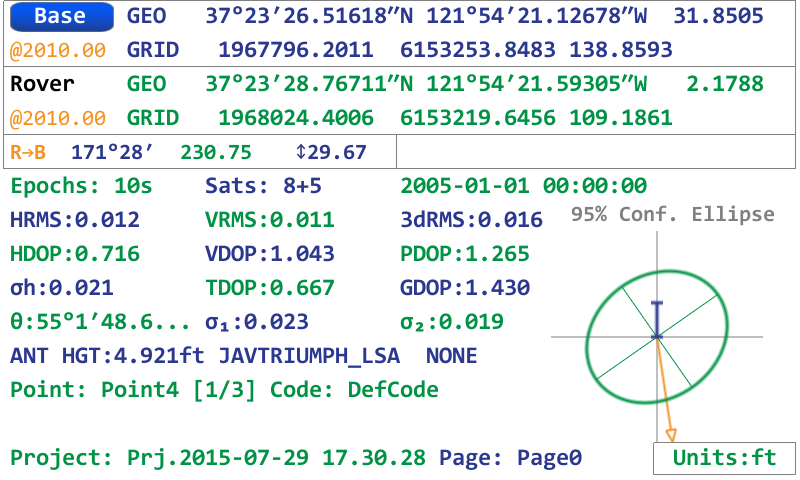
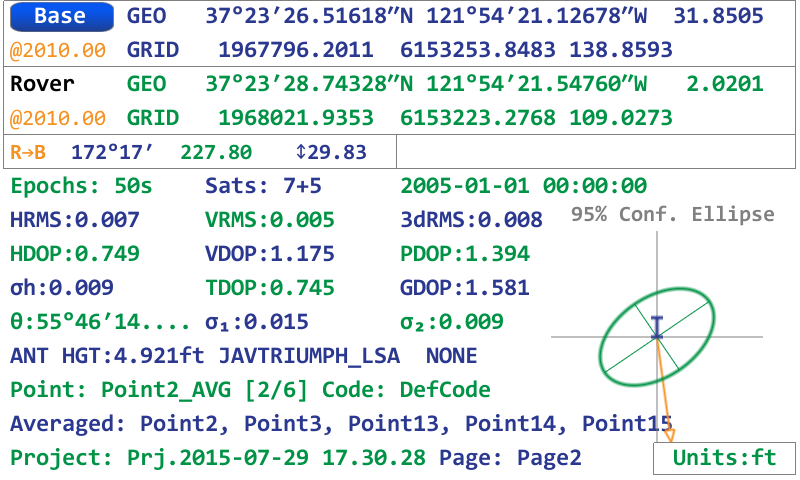
With the Base/Rover Statistics screen visible, pressing the UP arrow hardware button shows the Cluster Average Statistics screen. Here the user is given the extreme spread of the cluster of points, the average coordinates (weighted by the error estimates in the case of survey points), with the option to include only surveyed points or only design (imported/calculated) points or a combination. The Tolerance value sets the radius used to define what falls within a cluster.
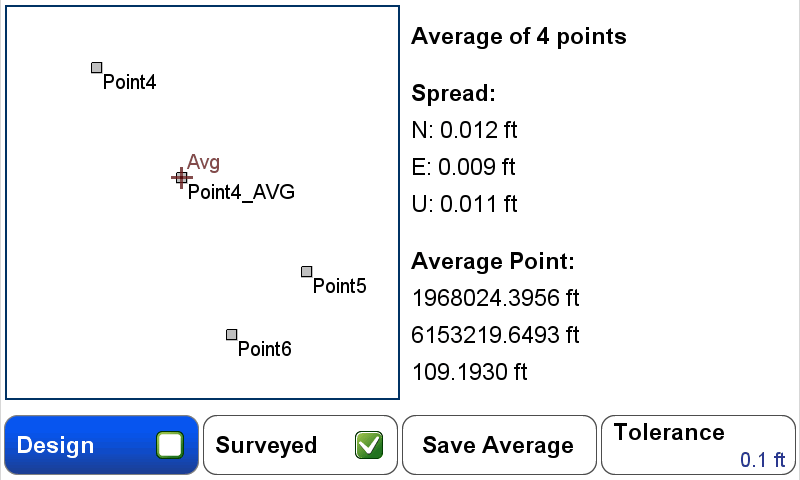
Pressing Save Average displays the Average Tool in COGO for final acceptance of the average.
The process described above creates averages from clusters one at a time as the user selects a point in a cluster
and initiates the average command from the review screen. However, J-Field can also create averages from clusters
automatically from the Additional Actions button  found in the Points Screen.
With this command all possible clusters are identified from the points currently visible in the points list
(excluding any points that have been filtered from view).
found in the Points Screen.
With this command all possible clusters are identified from the points currently visible in the points list
(excluding any points that have been filtered from view).
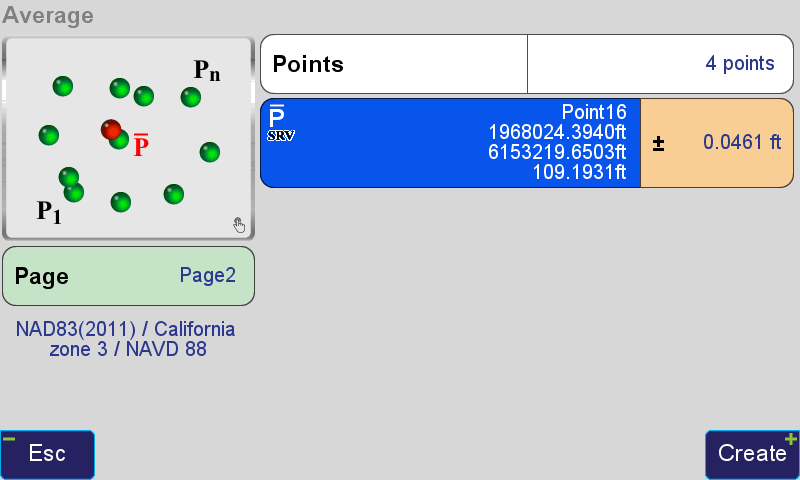
A Pop-Up screen appears with the option for Cluster Average.
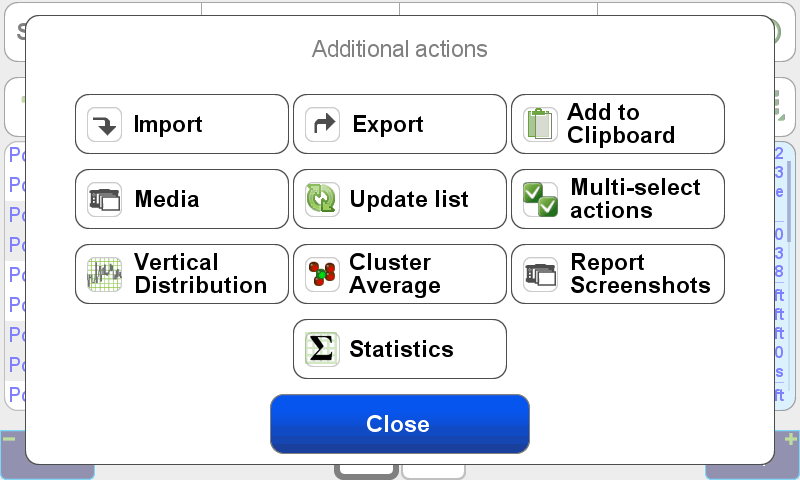
Selecting Cluster Average, J-Field detects all occurrences in the visible database of points within the user defined tolerance.
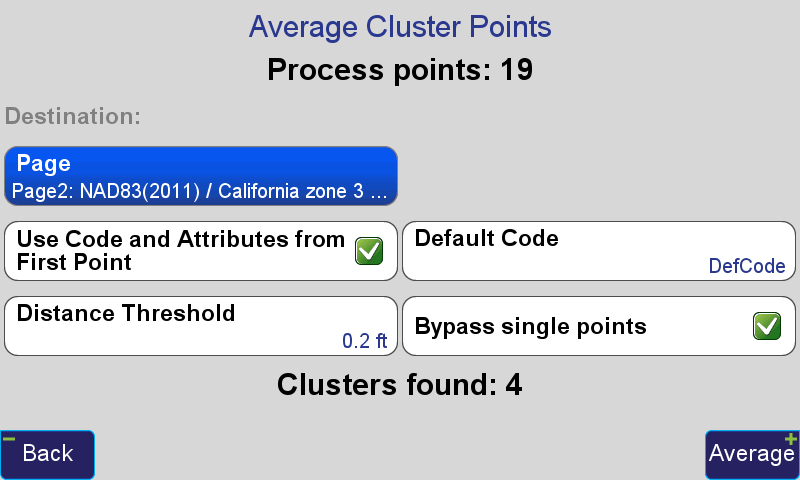
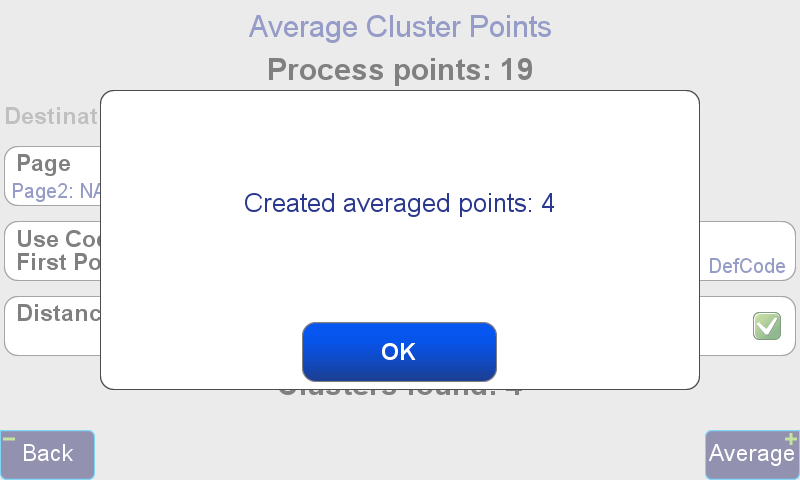
If, Average is selected, the average point of each detected cluster will be created automatically. The name of the point, by default, is [PointName]_AVG, with [PointName] being the name of the first point detected in the cluster. For example the averaged point from a cluster of points named Point4, Point5 and Point6, will be named Point4_AVE.
For efficiency, the Code and Attributes from the first point in the cluster can be assigned to the average point using the appropriate check box.
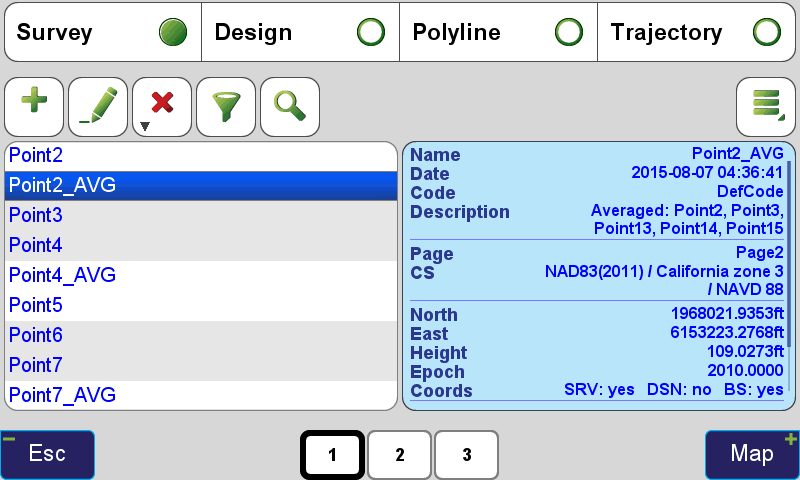
Once the points have been created from the Cluster Average Utility, they are visible in the Points Screen. If all of the points used in the Cluster are surveyed points, the resulting Average point is also created as a survey point, having the same number of epochs as the combined epochs from the points in the cluster. The error estimates are modified according to the combination of the errors of the individual points, generally resulting in much improved precision in the Average point.
Now there is no longer a need to manually determine how to handle redundant observations of the same point. Store a point as many times as you wish and let the Cluster Averaging simplify your processing time and improve the precision of the your surveys. J-Field's new Cluster Averaging takes only seconds to accomplish and can be done easily while still in the field.